So, I did this thing… It’s a little complicated to explain, but bear with me: I used a Software Defined Radio to capture the radio transmissions from a Bravo Ph esophageal monitor, wrote a browser-based decoder using the AudioData API, and reverse-engineered the broadcast data packets. As a bonus, I hope to do something similar to catch signals from a tiny satellite I helped fund on Kickstarter, which launches this weekend on SpaceX’s CRS-3 mission to the International Space Station.
Phew. Ok, now let’s break that down. 🙂
Software Defined Radio
Software Defined Radio (SDR) is central to all of this. It’s a pretty complex field — and I am by no means an expert — but the simplified basics are not hard to understand. Traditionally, a radio is built for a specific purpose with specific hardware. It’s effectively a black box customized to convert audio/video/data to or from a particular pattern of electromagnetic radiation in some particular part of the spectrum. Each box is different; you need one for satellite TV, one for FM radio, one for WiFi, one for GPS, and so on. There are myriad variations, and devices that might seem similar can actually be completely different. You’ve probably seen news reports about police and fire departments who are responding to the same disaster, but are literally unable to talk to each other because their radio systems are different.
SDR is a radical departure from all that. You still need a piece of hardware that can tune to a relevant slice of the radio spectrum, but it becomes a general-purpose device that relies on software to do all the application-specific bits. For example, you might ask such a device to tune to 66Mhz, and capture 3Mhz of bandwidth on either side. You then feed the result to a software NTSC decoder, et voilà, you’re watching TV (analog channel 4). The hardware doesn’t know anything about the contents of what it’s receiving, since it’s the software that deals with it. If your device can capture more bandwidth, you could even watch multiple channels at the same time. And since it’s just generic data being processed by software, it doesn’t need to happen in real-time. You can record a stream of RF data, and process it in different ways after the fact.

Until recently, SDR was only possible with fairly expensive equipment, which made it a niche hobby. But in the 2010-2012 timeframe, some folks discovered that a cheap USB device intended for digital TV reception (“watch TV on your laptop!”) contained surprisingly capable hardware that could be repurposed as a general-purpose SDR. Specifically, the RTL2832U chipset and a variety of tuner chips. For $10 to $20 you could get one of these mass-produced dongles that, with the right software, let you receive and decode all kinds of interesting transmissions from roughly 50Mhz to 1800Mhz.
Here are just a few of the things possible:
- Most obviously, listen to voice broadcasts: AM/FM, shortwave, air traffic control, police/fire dispatch, etc.
- Monitor aircraft traffic (position, speed, ID) in realtime by decoding ADS-B signals. Help crowdsource global coverage on flightradar24.com, or generate your own maps/tracking locally. Ditto for large ships and weather balloons.
- Decode location data broadcast by a news helicopter during a police chase.
- Display the latest weather images directly from NOAA satellites
- Listen to spacewalks on the International Space Station, or ham packet data bounced off the ISS’s repeater.
- Determine your position via GPS.
- Basic radio astronomy.
- Read your wireless electric meter or control a ceiling fan.
- Play with new Bluetooth LE beacons
- Listen through another laptop’s microphone — even when it’s off!
- Crack poorly-encrypted GSM cellphone conversations (N.B., this is probably illegal!). Part 1, 2, 3, 4.
- Monitor and reprogram a pacemaker. (N.B., homicide is quite illegal!)
- Oh, and of course you can use these DVB-T dongles for their intended purpose: to watch broadcast digital television. (Still stuck with analog TV? No worries, they can just barely decode that too.)
There’s a whole world of analog and digital RF data being broadcast around us, which cheap Software Defined Radio hardware makes readily accessible.
The Bravo Ph system
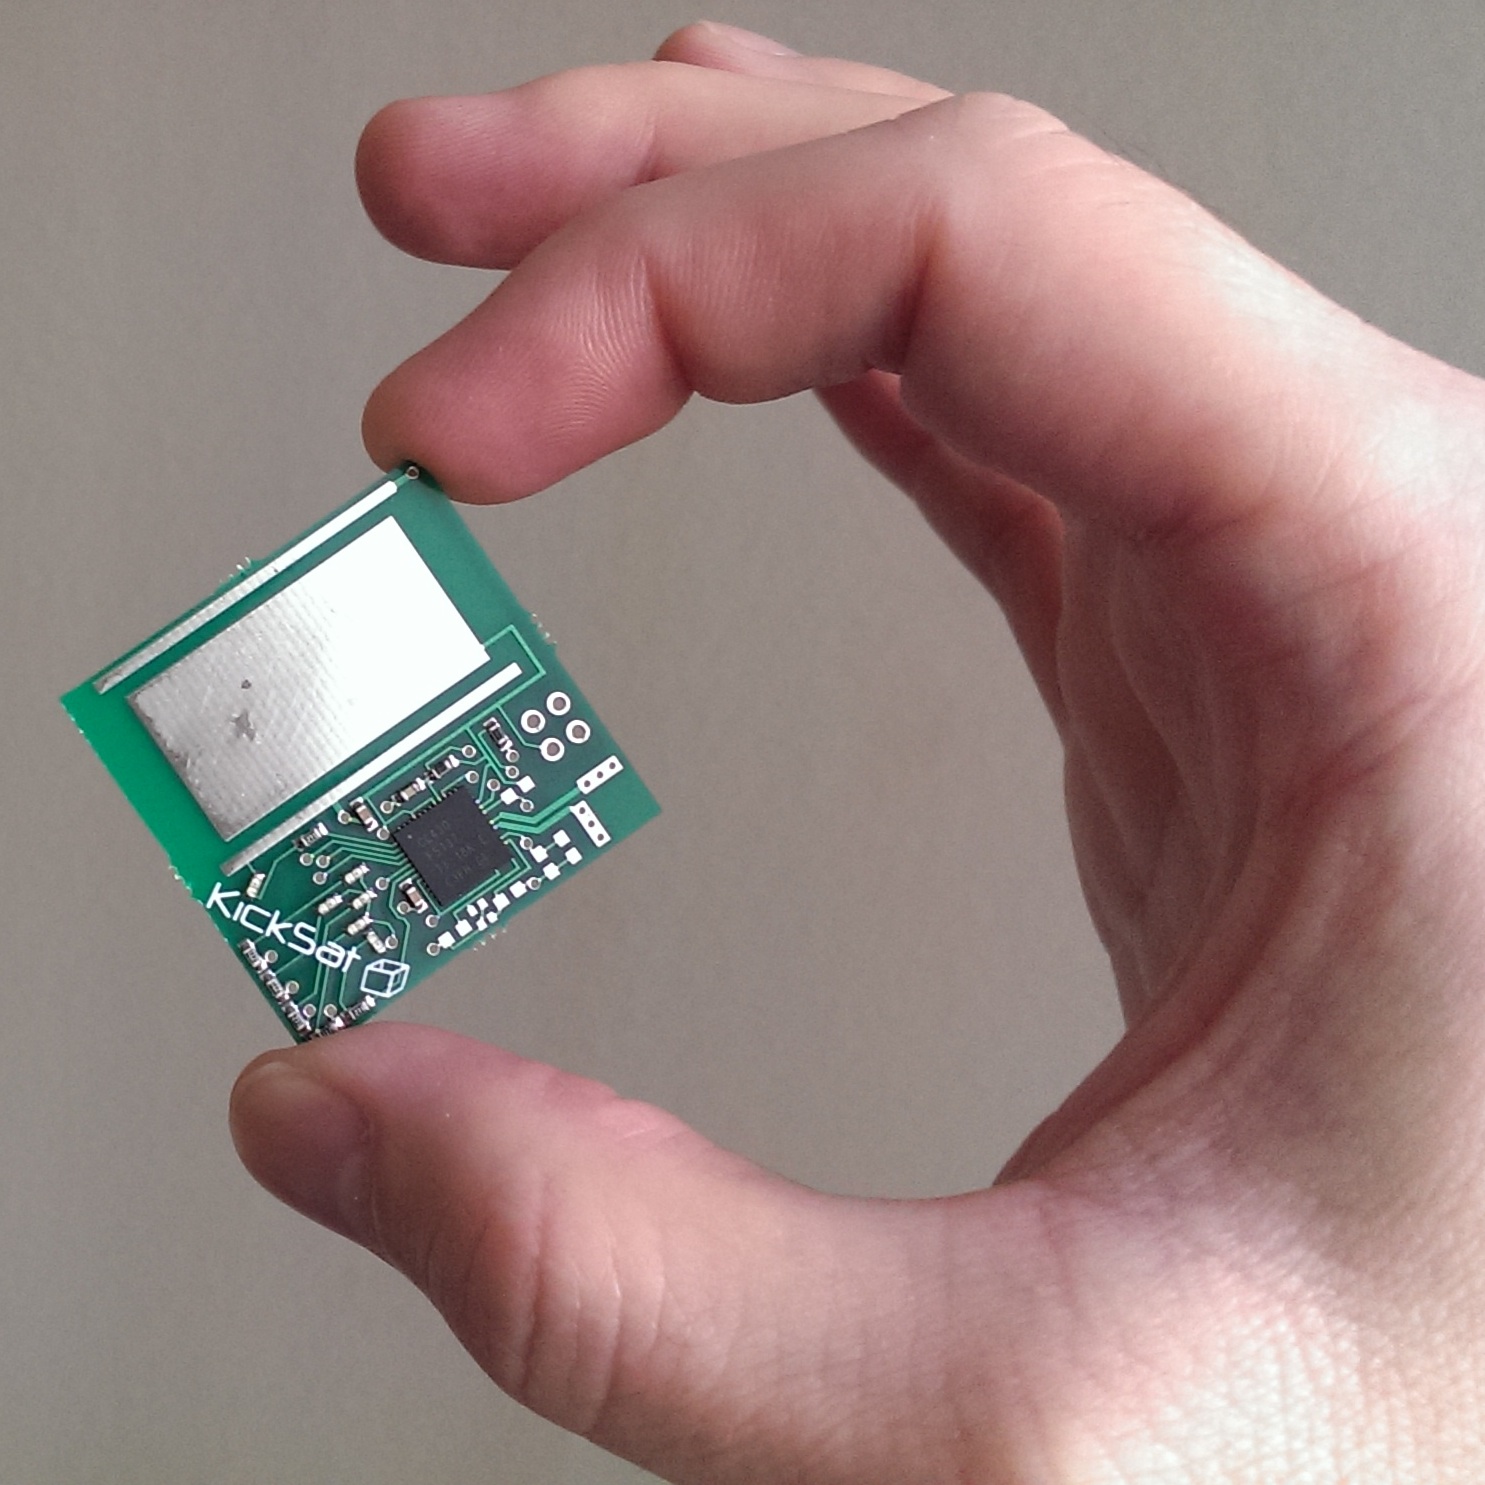
Around the time I was starting to play with SDR, I had gone to my doctor because I was experiencing some of the symptoms of acid-reflux. Or, as it’s more formally known, gastroesophageal reflux disease: GERD. [Spoiler: no big deal, weightloss + antacid and I’m all good.] One of the steps in the diagnosis is monitoring the acidity level in your esophagus over time. This used to involve inserting a tube into your nose and throat, leaving it there for a few days of measurement, and was generally quite unpleasant. Now they can just attach a tiny wireless sensor in you; it sticks there for about a week, and then gets eliminated naturally. It’s only a couple centimeters in size, and you don’t even notice it:

During the monitoring period, you carry around a receiver (which basically looks like a giant 1990-era pager). It’s supposed to be kept within 3 feet of you at all times, or else it makes an annoying beep when it loses the sensor’s signal. It records pH measurements every few seconds, and conveniently displays the last reading.

When the study is over, you return the receiver, your doctor downloads the data, and you get a nice little report with graphs and numbers to help your doctor make a diagnosis.
Capturing Data
So that’s SDR and Bravo Ph. Now, if you’re connecting the obvious dots like I was, you’re wondering if it might be possible to snoop on the sensor’s broadcasts to see what they contain. Indeed it is!
But the first step is finding the signal.
I wasn’t really sure where to start, but some Googling turned up a User’s Guide (doctor’s guide, really) for the system, and buried in an appendix was the info I needed:
Output & Transmission
EIRP: 17.6 μW (-47.53 dBm) at a 3-meter distance
Format: Amplitude-shift keying
Frequency: 433.92 MHz
Rate: 60 ms every 12 seconds
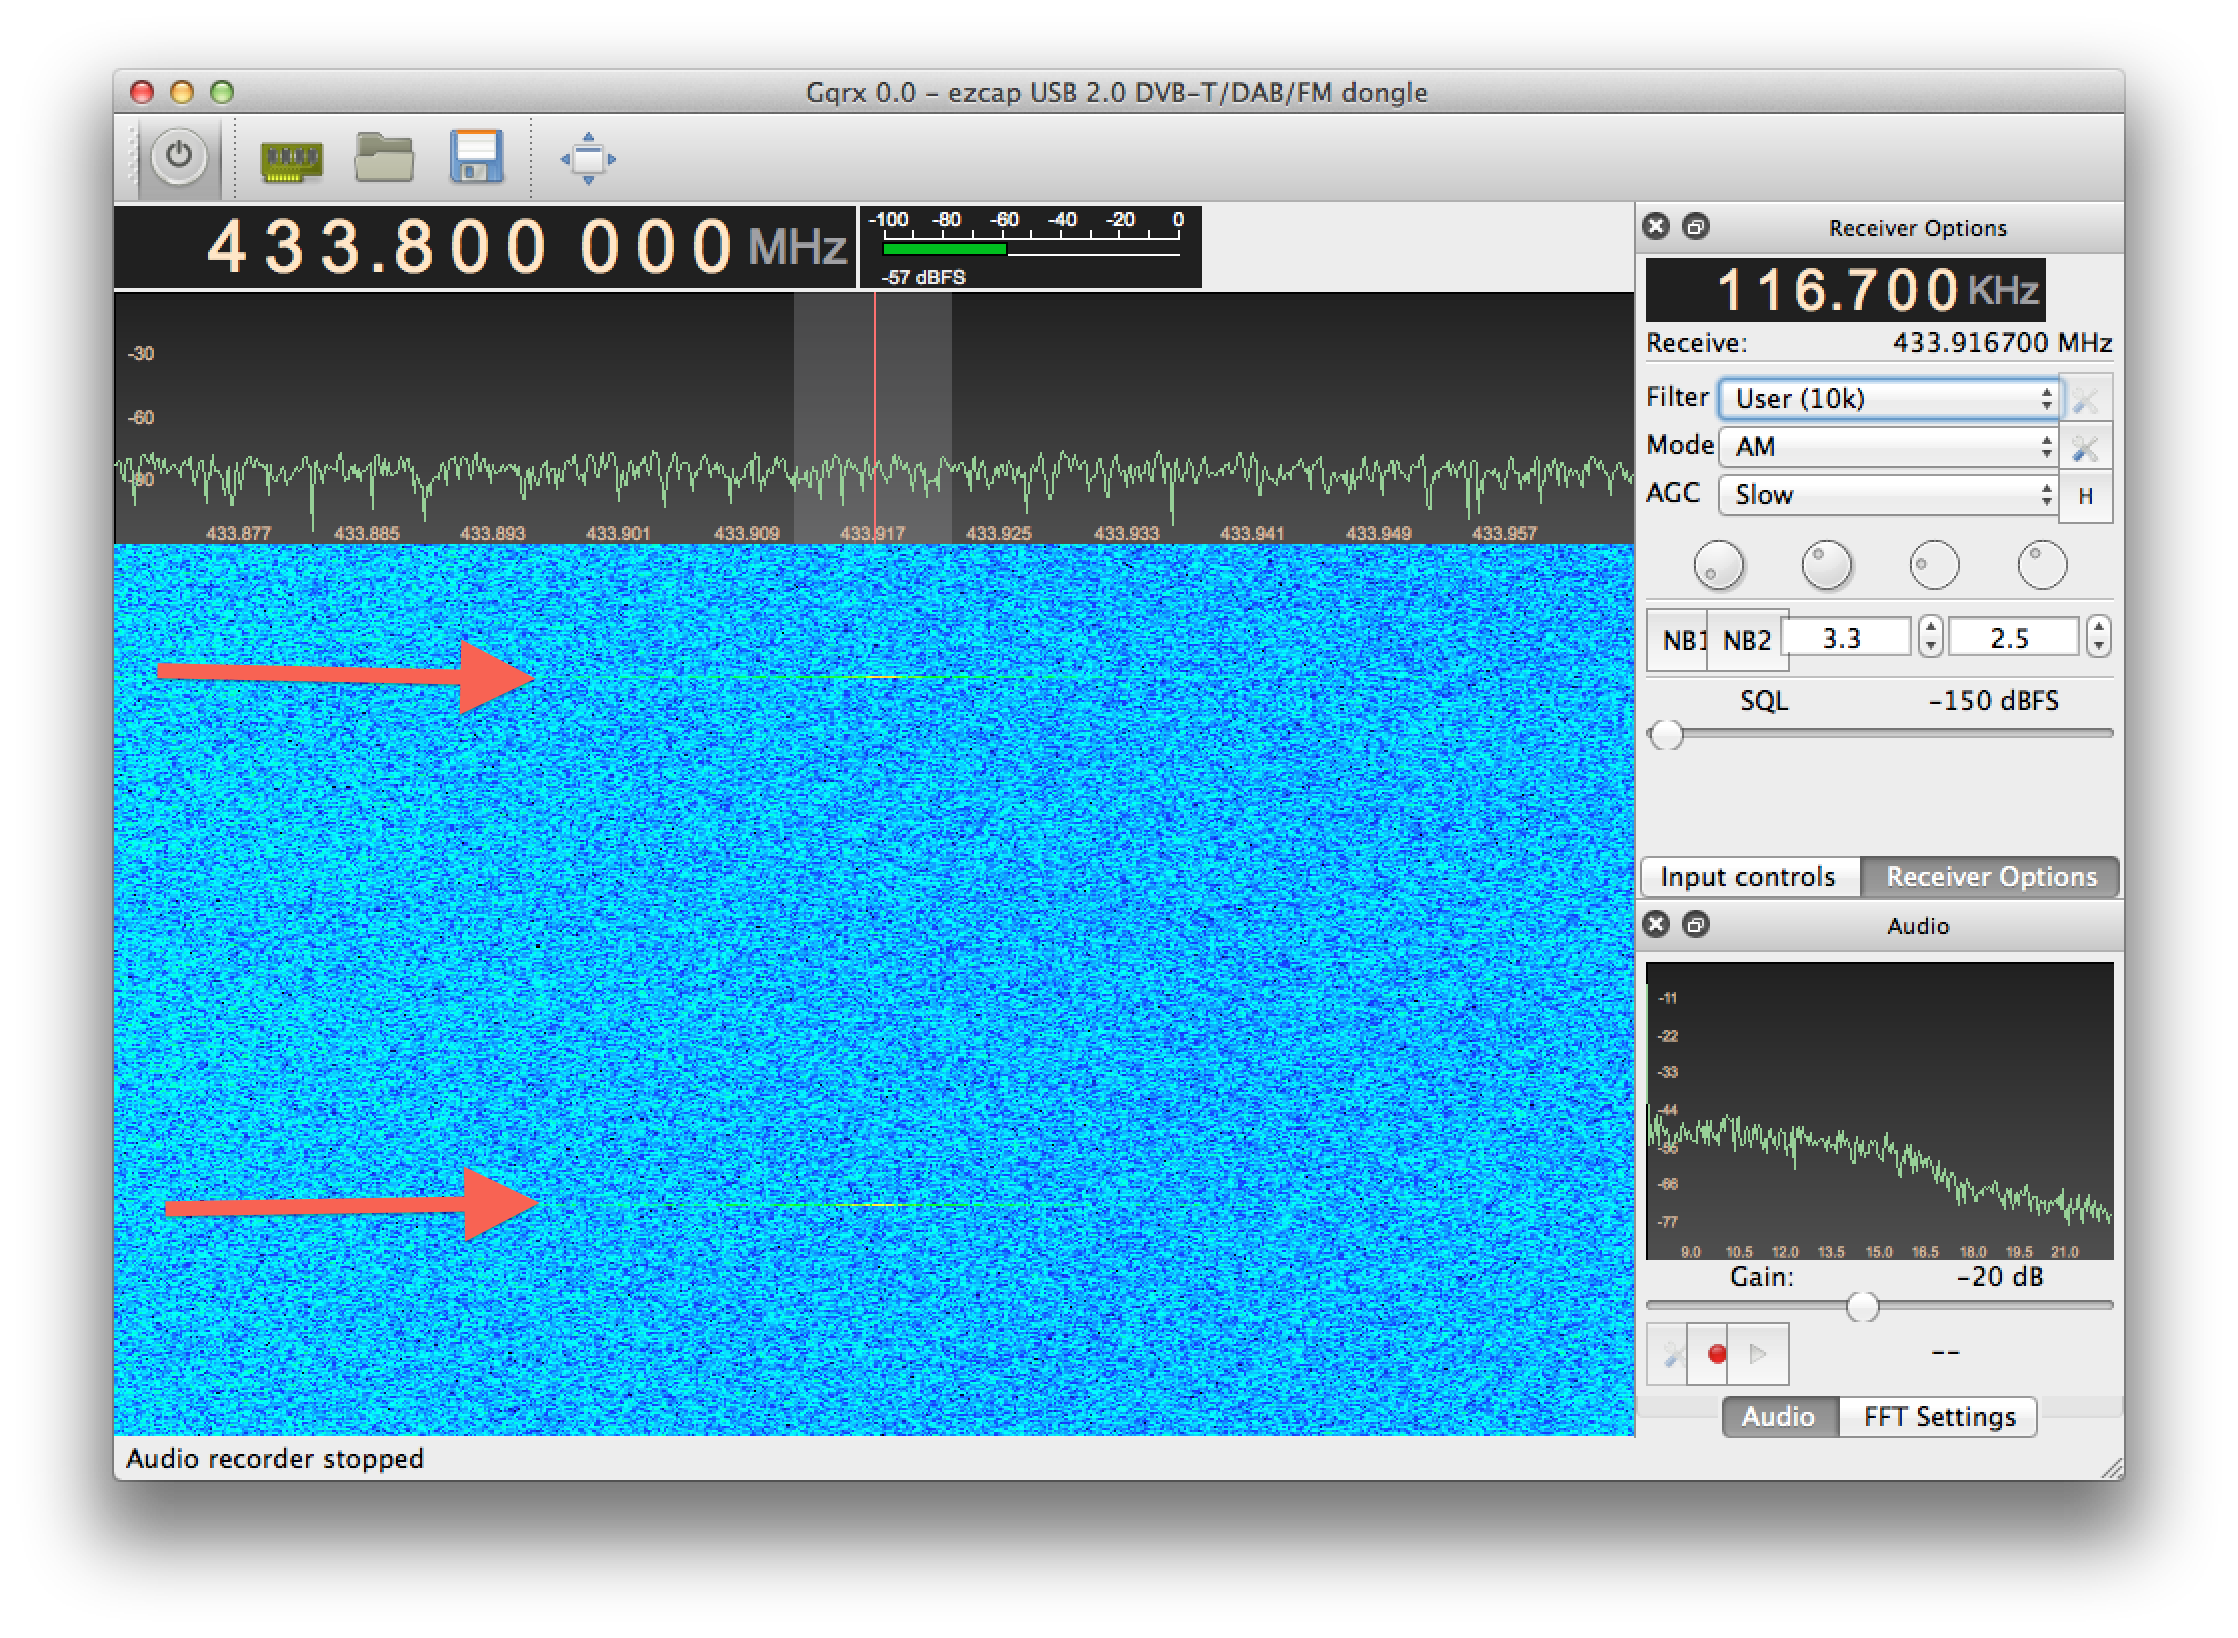
Bingo! All I needed to do was tune my dongle to around 433.92MHz, and look for a bursty signal repeating about every 12 seconds. It was literally as simple as that — here’s a waterfall display from the GQRX app I was using, showing two transmissions (time is the vertical axis, frequency is the horizontal):
And here’s what it sounds like as AM-demodulated audio: MP3 | WAV (Sorry, WordPress doesn’t seem to support inline HTML5 audio.)
Decoding Data
Ok, so now we get signal. But what’s in it? The brief bursts are obviously too fast for our meaty ears to discern meaning, so looking at the waveform in an audio editor was the easiest way to take a first look. I used Audacity on OS X:
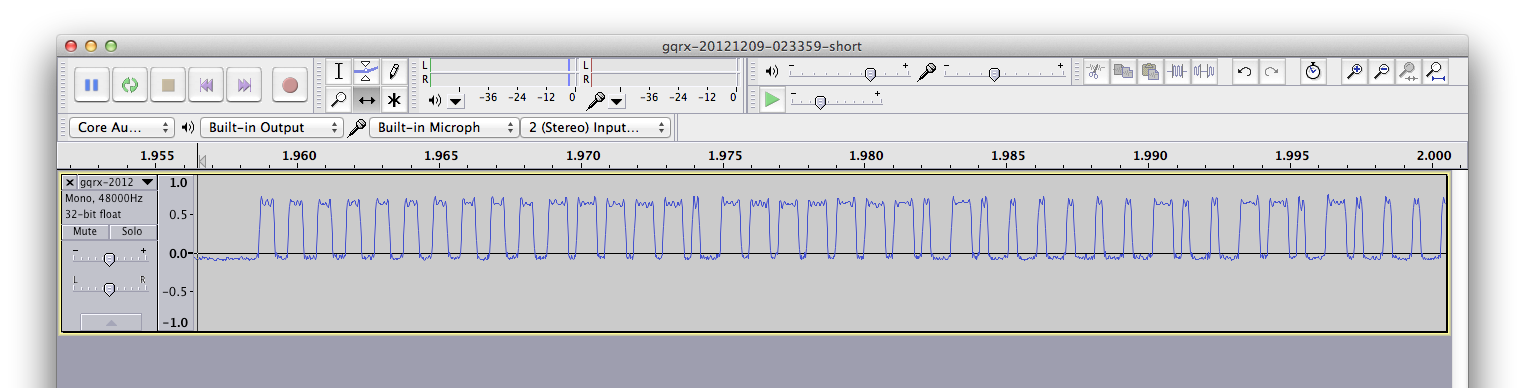
Ah, there it is. Digital data. There are clear hi/lo levels, but what’s actually important is the length of the pulses. After examining a few more transmissions, the basic format of the data packet is apparent:
- A preamble consisting of 10 500μs hi pulses (each separated by 500μs lo). This likely serves as a clear “beginning of message” indicator, and to establish clock speed.
- 48 bits (6 bytes) of data. Each bit is 1 millisecond; with a “0” indicated by 250μs hi followed by 750μs lo, and a “1” indicated by 666μs hi followed by 333μs lo.
- A single 500μs hi stop bit.
(Note that I’m slightly rounding the timings to what would seem to be likely values. The actual data is imprecise due to noise and rising/falling edges, on the order of tens-of-microseconds.)
I decoded a few packets by hand, both for fun and to validate the format. But it quickly became tiring to scribble down data like “pppppppppp111110111111101000000100110100011101000001100101s” and then convert it to hex (fbfa04d1d065), so I decided to write a tool to do it. In the browser, of course!
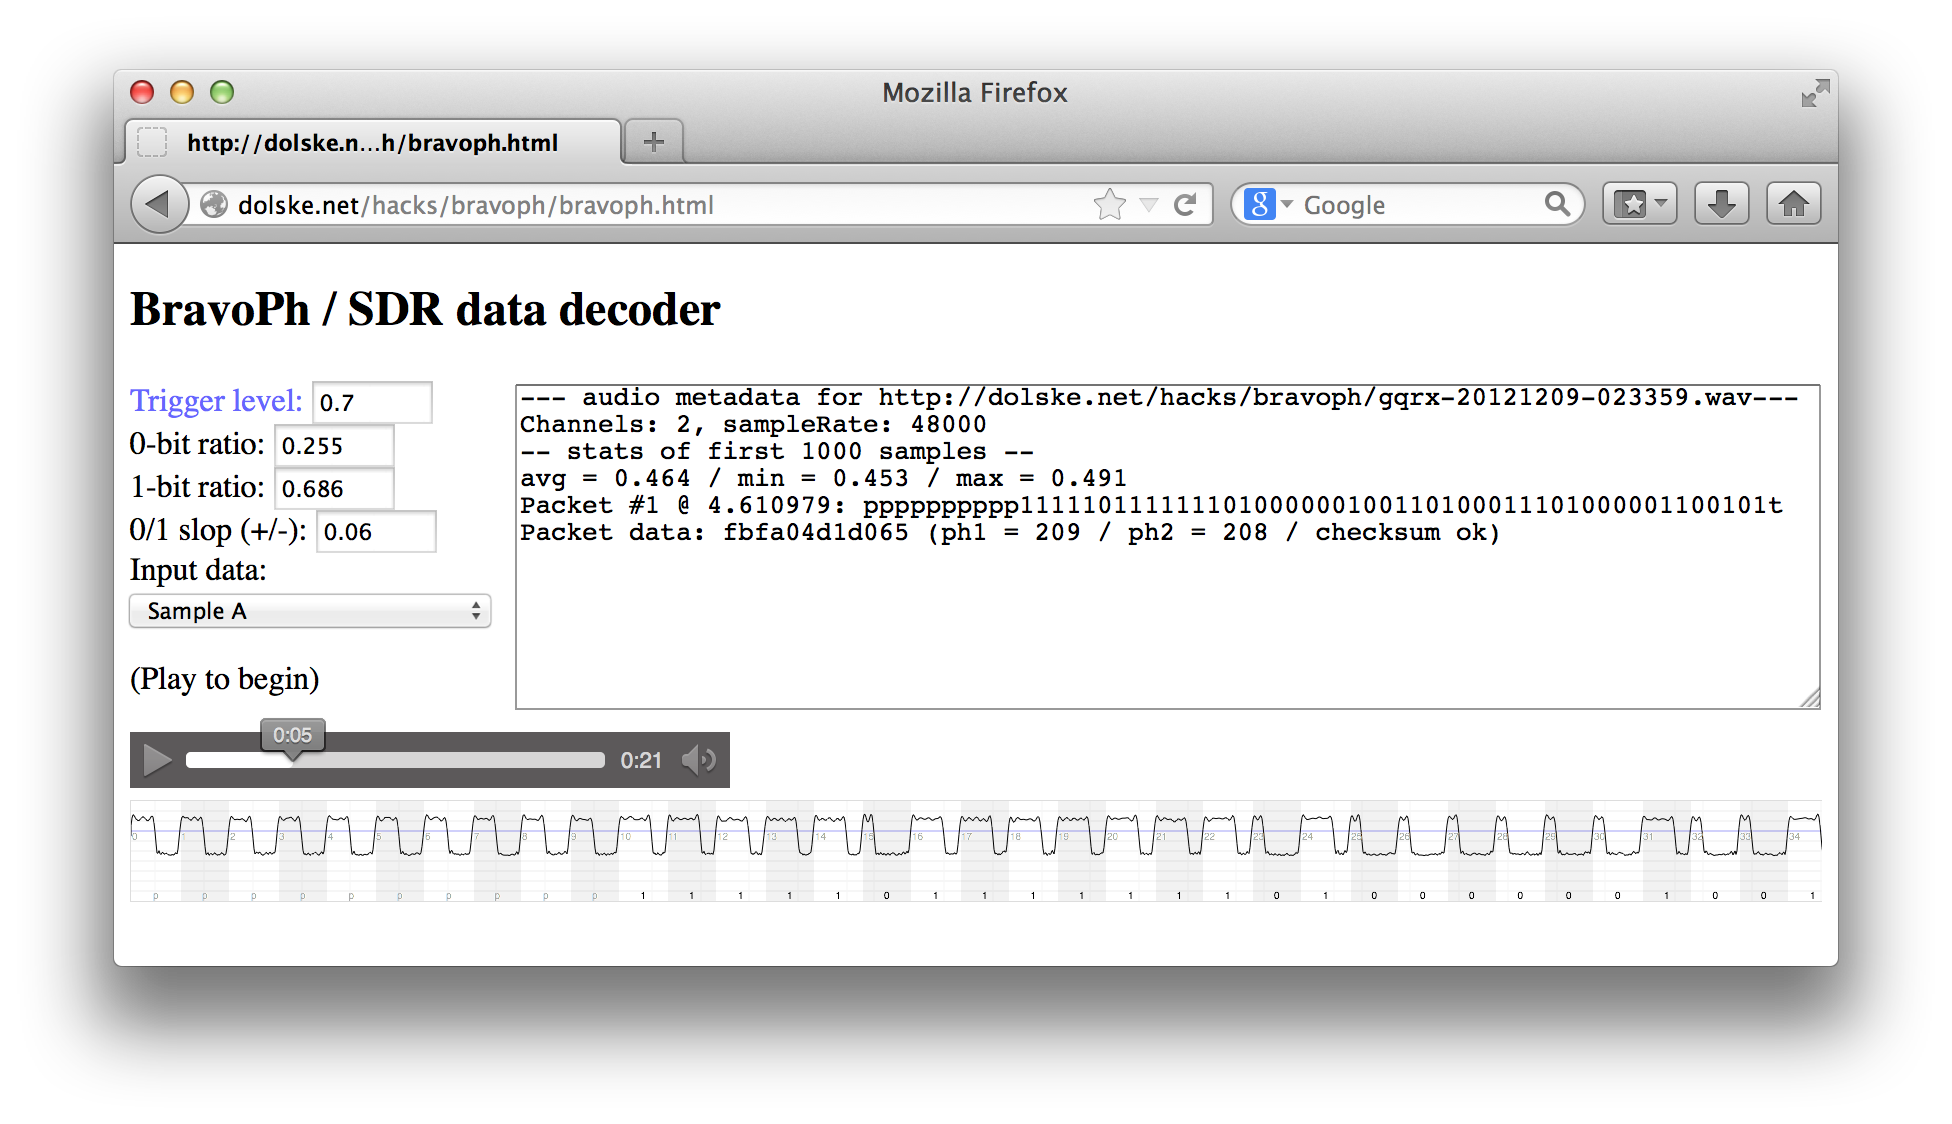
At the time, Firefox supported a simple low-level Audio API that was exactly what I was looking for. In a nutshell, you add a MozAudioAvailable event listener to an <audio> element, and the listener periodically gets an array of sample data as the media plays. I implemented a simple state machine to decode the data, based on a manually set threshold between the hi/lo states (and some fudge-factors to deal with the imprecision/noise previously noted). I’m sure there are more elegant and automatic ways to do this, but simple brute force was enough for my limited needs. The one annoying downside is that this API can only process in real-time(!); there’s no way to ignore playback speed and just get all the data as fast as possible. If you’d like to play around with it, here’s a live demo and the source on Github. (*cough* I’ve been so slow in finishing this post, that the Audio API I’m using has been removed from Firefox 28, in favor of the newer Web Audio API. So you’ll need an older Firefox, or just gaze upon the following screenshot.)
Ok, so now I’ve got a bunch of decoded data values to examine, such as:
fbfa04b4b79b
fbfa04b4a9a9
fbfa049b80eb
fbfa04857a07
fbfa04858af7
fbfa048483ff
What do they mean?
The first 3 bytes (0xFBFA04) are always the same, so that’s presumably a serial number or unique ID (and the manual confirms that during setup, there’s a step to ensure that the receiver is getting the expected sensor ID).
The next two bytes must be the actual pH measurements. They are usually similar to each other, and by graphing the values I can see they follow the trend of the pH values reported on the receiver (which I was writing down when capturing the transmissions). Why two values? The manual says that a measurement is made every 6 seconds but a transmission only every 12, which I assume is done to save power. The pH is roughly obtained by dividing the byte’s value by 25 — but it looks like it’s somewhat non-linear or uncalibrated, as data for the lowest pH values needs to instead be divided by 30 to match what the receiver reports.
The last byte took a bit more effort to figure out. At first glance it appeared fairly random, so I assumed it was some kind of checksum. Validating medical data seems important, after all. Probably something simple to compute for an 8-bit microcontroller, so no fancy FEC or CRC magic… I fiddled around with a few guesses, but graphing the data led me to the answer:

The checksum value (green) looks like a stretched, inverted, and offset version of the average pH (yellow). How about (pH1 + pH2) ^ 0xFF + 7? (All modulo-255, since this is likely an 8-bit microcontroller.) That’s it! It correctly generates the observed checksum for each of the 144 packets I captured.
So with that, I’m able to decode, interpret, and validate the data packets. Neat. It’s not directly useful for anything, but made for a fun experiment.
Afterwards, I got to wondering if there might be some further technical details buried somewhere online to help explain or confirm what I found. I’ve seen patents and FCC filings used to glean data in other cases, so I went to look…
Patent US6689056 has a number of interesting tidbits. It indicates that the microcontroller in the sensor is probably a MicroChip 12C672 (a member of their PIC family, which is similar to the Atmel AVR family familiar to Arduino folks). There’s a basic description of the packet format, but the only detail I hadn’t caught was that the 3-byte header is actually a 2-byte ID and a 1-byte Message Type (I only ever saw one type). It does confirm that the last byte is a checksum, but doesn’t go into how it’s computed.
On the FCC’s website, I found a 4/25/2001 application from Meditronics for the PHZ-BRAVO100, which has a number of close-up photos and an extremely detailed Test Report. It basically confirms what I had found, with additional info on the bit timing and packet format, and also reveals that there is a “transmitter status” message type that’s sent once an hour.
Kicksat
Now let’s shift from inner space to outer space — or at least low Earth orbit. Back in November 2011, a fascinating project appeared on Kickstarter: “KickSat – Your personal spacecraft in space.” Usually satellites are large vehicles that cost millions, but recently this has been made more affordable by using the small, standardized Cubesat format (a 10cm cube, weighing 1.3kg). KickSat takes this a step further, by packing a Cubesat carrier with tiny “nanosatellites” (3cm square, weighing a few grams). That brings the cost down to just $300 to sponsor a KickSat in orbit, broadcasting a custom callsign and other simple data. They don’t do much, but it helps demonstrate the concept of using a fleet of cheap, simple sensors instead of a single expensive “Cadillac” spacecraft. For example, instead of predicting space weather using reports from a handful of satellites, you might use a huge number of cheap nanosatellites monitoring a wide area.
As a bonafide space nerd, I jumped at the opportunity. And now, after a long wait, KickSat is poised to launch in just a few days (March 30th), onboard the SpaceX CRS-3 resupply flight to the International Space Station. Assuming all goes well, the KickSat CubeSat carrier will be deployed immediately after 2nd stage cutoff. It orbits by itself for 16 days, to ensure wide clearance from the ISS, and then deploys its 104 KickSats. Including mine, which will be broadcasting “MOZFF“. They’ll orbit for a few weeks, and then burn-up as they reenter the atmosphere. (No space junk!)

The project is publishing info about the satellite’s transmissions, as well as info on how to set an inexpensive ground station using… That’s right, software defined radio (GNURadio + RTL2832U dongle). I’ve got my equipment ready, and will attempt to capture signals from KickSat while it’s in orbit. More on that after launch!

Great post. Can you please give me some details about the antennas being used? My HF knowledge is pretty low but as far as I know you need a different antenna length for each frequency and wavelength, right?
For KickSat, I’m using a yagi tuned for the 70cm band they’re on, plus a low-noise amp, since they’re extremely weak transmitters.
For just playing around with stronger signals elsewhere, the crappy little antenna that came with the dongle can be adequate. (Although some people have found their antennas are not even connected internally, which tends to be not-adequate!) You can get wideband antennas that are much much better. And of course if you’re really keen on pulling in weak signals in a specific band, you can start optimizing for that with specialized antennas and other hardware.